
16·
21 days ago
It’s the foams specifically for fighting fuel fires that are made from PFAS. Unfortunately, their safety gear also is loaded with PFAS.
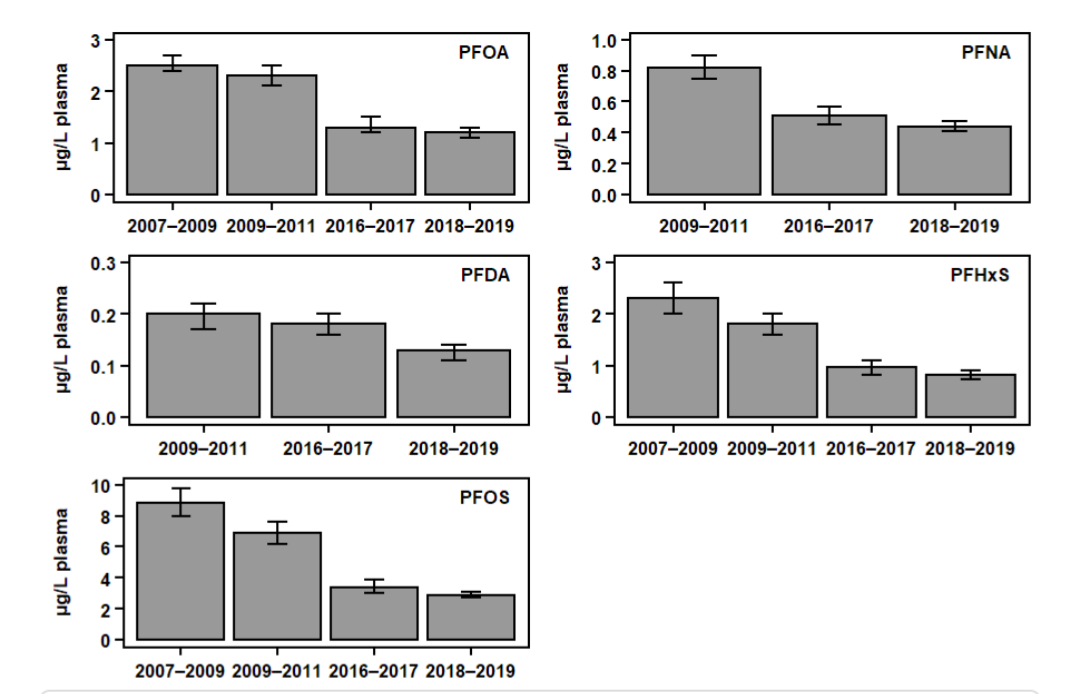
Blood serum PFAS concentrations thankfully have been decreasing over time. It’s probably not worth getting yours tested unless you had some specific exposure other than consumer goods. You should ask your doctor, if you have one.
This data is from Canada, but the results are similar for the US.

Unfortunately, even if we stopped using PFAS entirely it will remain a legacy problem in wastewater and landfills because so many consumer products contain PFAS. That said, some places are working towards banning PFAS in new products and some of the really nasty ones are already banned in many countries. Here is Canada’s plan to phase PFAS out of industrial and consumer goods:
For simplicity, this process is called clarification.
Unfortunately, coagulants are not effective at removing PFAS. The only effective methods for PFAS removal are adsorption (using granular activated carbon or ion exchange resins) or reverse osmosis filtration. These approaches are not used in traditional wastewater treatment because they are very expensive and are not required to meet registrations. However, potable reuse facilities will use these approaches to further treat wastewater effluent to drinking water standards. This is the future of water supply for arid areas like the southwest USA.
Also PS, the most commonly used coagulants are aluminum sulphate (alum) and ferric sulphate, which are not polymers. Polymers definitely are used (especially where I live) but they are more expensive and thus avoided when not needed.

It was the triple alliance, also called the Tenochca Empire.

R with the tidyverse package is amazing once you get over the learning curve. It’s so much easier to simply type a few lines of code then to fiddle with the Excel GUI, plus the ability to customize the plot is much, much better in R.
Yes making a simple plot in Excel is relatively easy, but try making something evening remotely complex and it’s terrible. A box plot is a great example of this, 2 lines of plotting code in R for a basic plot but an absolute nightmare to create in Excel.